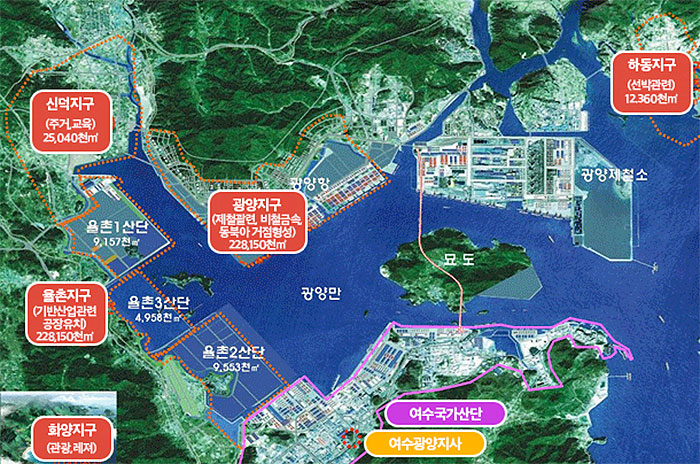
Yeosu Industrial Complex has contributed to the development of national economy through continuos industrial development and played a pivotal role as a growth basis of national and local economy.
Scale of Complex
| Classification | Construction Period | Total Size | Industrial Facilities | Support Facilities | Public Facilities | Green Space |
|---|---|---|---|---|---|---|
| Existing Industrial Complexes | '67. 2 ~ '98. 12 | 23,642 | 17,005 | 1,412 | 2,979 | 3,001 |
| Expanded Industrial Complexes (Under construction) |
'92. 3 ~ '13.12 | 7,986 | 5,814 | 208 | 952 | 257 |
| Total | 31,628 | 22,819 | 1,620 | 3,931 | 3,258 |
Number of businesses (as of 2020)
294 companies (Building A: 264)
Production and Exportation
| Classification | Performance in 2015 | Performance in 2016 | Performance in 2017 | Performance in 2018 | Performance in 2019 | Performance in 2020 |
|---|---|---|---|---|---|---|
| Amount of Production |
69 trillion 38.90 billion |
66 trillion 17.39 billion |
79 trillion 95.84 billion |
83 trillion 65.81 billion |
60 trillion 85.82 billion |
48 trillion 8.59 billion |
| Amount of Exportation |
$3.01 billion 42 million |
$2.86 billion 13 million |
$3.27 billion 13 million |
$3.10 billion 80 million |
$2.25 billion 70 million |
$1.76 billion |
Employment Status
24,390 people (As of December 2020)
Major Business Types
- Oil Refining
800 thousand B/day (24% of domestic process capacity 3.28 million B/day) Representative company: GS Caltex Corporation - Petrochemistry
Ethylene 4.36 million tons/year (46% of total domestic production capacity 9.49 million tons/year) Representative companies: LG Chemicals, LOTTE Chemicals, Yeocheon NCC - Fertilizer
480 thousand tons/year (49% of total domestic production capacity 980 thousand tons/year) Representative company: NAMHAE Chemical Corp
Gwangyang Bay Zone Development Plan


